
How to Identify and Trade Chart Patterns in Crypto
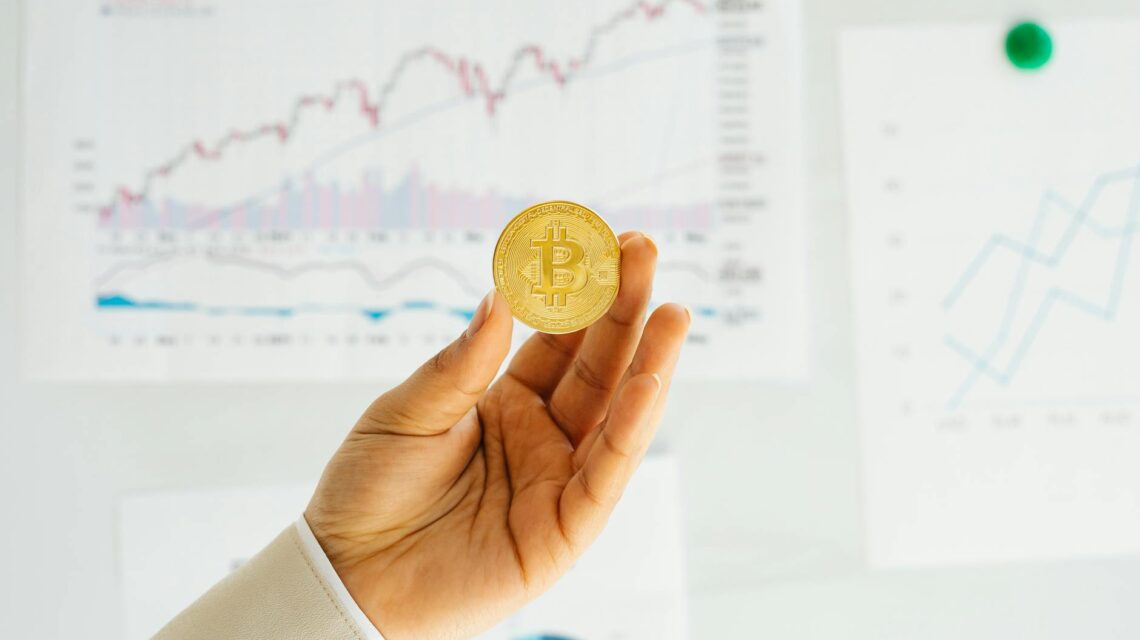
Navigating the thrilling, yet volatile world of cryptocurrency trading can feel like riding a rollercoaster. But seasoned traders know that understanding chart patterns can be a game-changer. These visual representations of price action offer valuable insights into potential future market movements. This comprehensive guide will equip you with the knowledge to identify and trade chart patterns effectively, empowering you to make more informed decisions in the crypto market.
Why Chart Patterns Matter
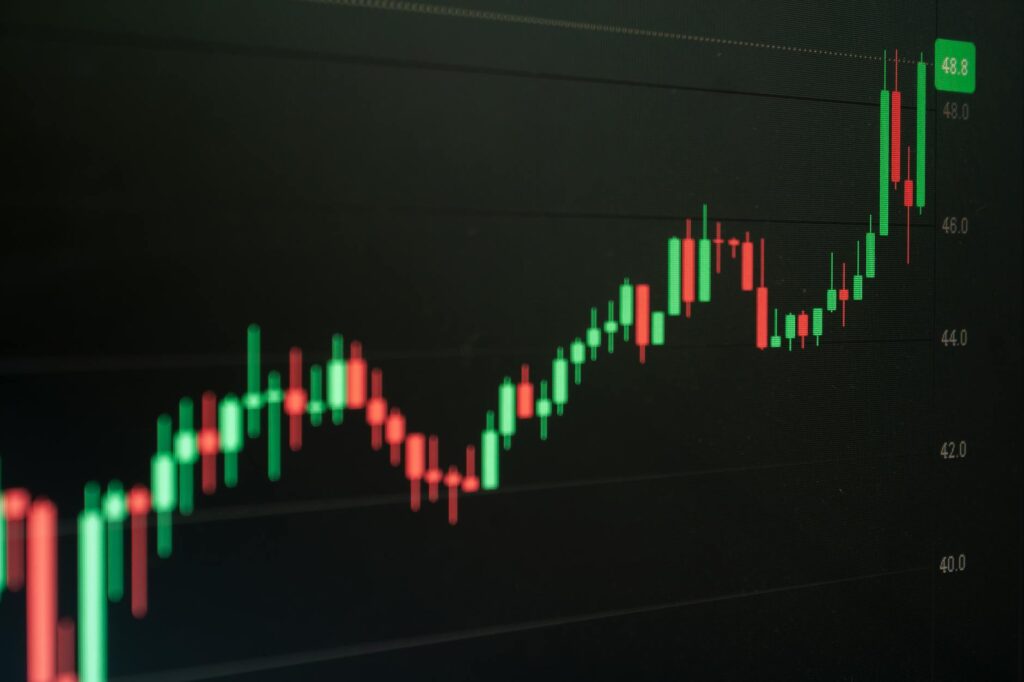
Chart patterns are more than just lines on a graph; they reflect the collective psychology of traders and investors. By recognizing these recurring patterns, you can anticipate potential breakouts, reversals, and continuations, giving you an edge in the market.
Bullish Chart Patterns
- Head and Shoulders Bottom (Inverse Head and Shoulders): This pattern signals a potential trend reversal from bearish to bullish. It consists of three troughs, with the middle trough (the “head”) being the deepest and the two outer troughs (the “shoulders”) being shallower.
- Ascending Triangle: Formed by a horizontal resistance line and a rising trendline, this pattern suggests increasing buying pressure and a potential breakout above the resistance.
- Bullish Pennant: A short-term continuation pattern characterized by converging trendlines forming a triangular shape, resembling a pennant. It typically follows a sharp price movement and indicates a potential continuation of the uptrend.
- Bullish Flag: Similar to a pennant, but with a rectangular shape instead of a triangle. It signals a brief pause in an uptrend before the price potentially resumes its upward trajectory.
Bearish Chart Patterns
- Head and Shoulders Top: The inverse of the head and shoulders bottom, this pattern signals a potential trend reversal from bullish to bearish. It features three peaks, with the middle peak (the “head”) being the highest and the two outer peaks (the “shoulders”) being lower.
- Descending Triangle: Formed by a horizontal support line and a descending trendline, this pattern suggests increasing selling pressure and a potential breakdown below the support.
- Bearish Pennant: A short-term continuation pattern characterized by converging trendlines forming a triangular shape, pointing downwards. It usually follows a sharp price drop and suggests a potential continuation of the downtrend.
- Bearish Flag: Similar to a bullish flag but formed during a downtrend. It represents a short pause in the decline before the price potentially continues its downward movement.
Confirmation and Risk Management
It’s crucial to confirm the validity of a chart pattern before entering a trade. Look for increased volume accompanying breakouts, as this strengthens the signal. Implement robust risk management strategies, such as setting stop-loss orders, to protect your capital. Remember, no trading strategy is foolproof, and the crypto market is inherently risky.
Trading based solely on chart patterns can be risky. Combine pattern analysis with other technical indicators and fundamental analysis for a more holistic approach.
Advanced Chart Patterns
Beyond the basics, there are several advanced chart patterns that can provide valuable insights. These include:
- Cup and Handle: A bullish continuation pattern shaped like a cup with a handle forming on the right side.
- Double Top/Bottom: Reversal patterns characterized by two consecutive peaks (double top – bearish) or troughs (double bottom – bullish) at roughly the same price level.
- Triple Top/Bottom: Similar to double tops/bottoms but with three peaks or troughs instead of two, signaling even stronger reversal potential.
Practicing and Refining Your Skills
The best way to master chart pattern identification is through consistent practice. Use charting tools on crypto exchanges or dedicated platforms to analyze historical price data. Backtest your strategies to see how they would have performed in the past. Join online communities and forums to discuss chart patterns with other traders.
Beyond the Charts: Fundamental Analysis
While technical analysis using chart patterns is powerful, don’t neglect fundamental analysis. Understanding the underlying technology, team, adoption rate, and market trends of a cryptocurrency can provide a broader context for your trading decisions.
Conclusion
Chart patterns are a valuable tool for any crypto trader. By learning to identify and interpret these patterns, you can significantly enhance your trading strategy. However, remember that trading always involves risk. Combine chart pattern analysis with other technical indicators, fundamental analysis, and sound risk management practices for a comprehensive approach to navigating the exciting world of cryptocurrency trading.

 Backtest Crypto Trading Strategies: A Complete Guide
  NFT Standards: A Cross-Chain Guide for Creators & Collectors
  Decentralized Storage: IPFS & Arweave Explained Simply
  How to Calculate Cryptocurrency Taxes: A Simple Guide
  Your Guide to Music NFTs & Top Platforms for 2024
  TradingView for Crypto: The Ultimate Trader’s Guide
  Backtest Crypto Trading Strategies: A Complete Guide
  NFT Standards: A Cross-Chain Guide for Creators & Collectors
  Decentralized Storage: IPFS & Arweave Explained Simply
  How to Calculate Cryptocurrency Taxes: A Simple Guide
  Your Guide to Music NFTs & Top Platforms for 2024
  TradingView for Crypto: The Ultimate Trader’s Guide